
Subscribe
Be the first to know about our latest posts.
Explore Icreon’s Data Engineering and Consulting Services

Choosing the Right Data Interpretation Solution for Your Business
In today's data-centric business landscape, organizations express a common challenge: how to harness the power of data to overcome obstacles, seize opportunities, and make decisions that propel success. From deciphering market trends to optimizing supply chains, the business world relies significantly on data analytics. According to a recent survey by Gartner, 91% of organizations invest in analytics to enhance their decision-making processes.
This brings us to a puzzling crossroads. In our age of information abundance, selecting the right data interpretation tool feels like searching for a needle in a haystack of data. It's not just about choosing; it's about finding the tool that suits your industry, meets your goals, and matches your team's skills.
You don’t need to worry about this, as we’ve found your compass in this sea of options. This blog lists the top 7 data analytics and visualization tools along with each tool's strengths, real-world applications, and potential.
Ebook: Role of Recommendation Systems and Machine Learning to Boost Customer Engagement
Your guide to personalization techniques and recommender system. Explore the challenges, benefits, and best practices involved.
The Best Data Analytics and Visualization Software
To simplify your choice of data analytics and visualization software, we've curated a list of the eight best data analytics and visualization tools. Each of these solutions has been carefully selected for its ability to provide powerful insights, user-friendly interfaces, and the tools necessary to turn complex data into compelling visual narratives.
Whether you're a data scientist, business analyst, or simply someone looking to harness the power of data for your business success, this comprehensive list will help you explore and select the perfect software to meet your specific needs and objectives.
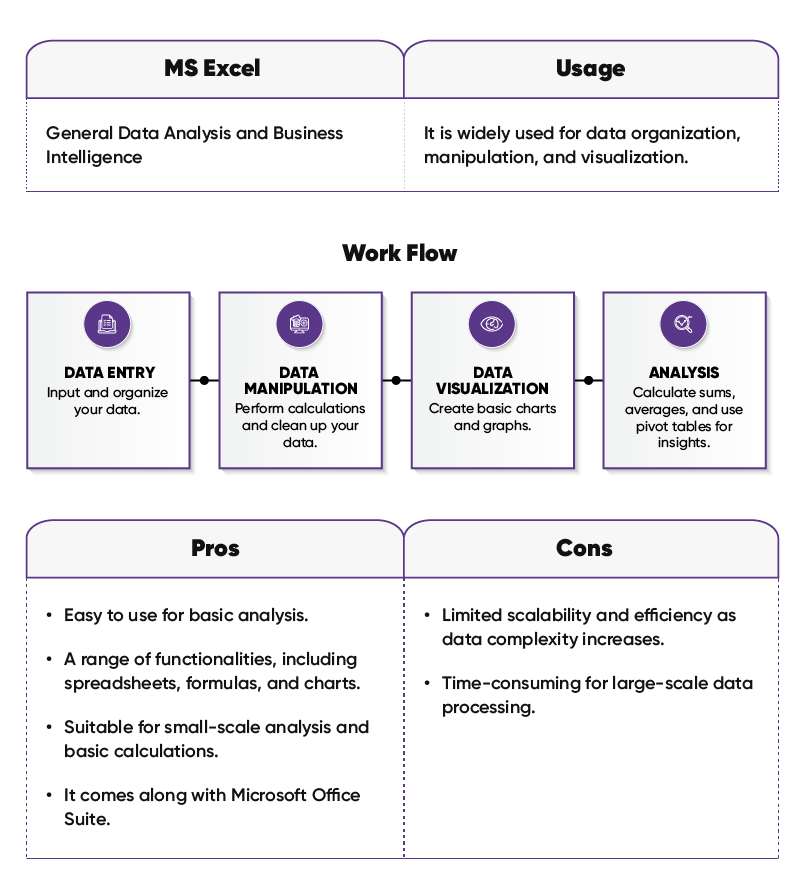
Microsoft Excel
Microsoft Excel serves as a powerful analytics and data visualization tool, allowing users to analyze complex datasets efficiently. With versatile functions and charting options, it transforms raw data into meaningful insights. Excel's user-friendly interface makes it accessible for beginners and seasoned analysts, enhancing decision-making across diverse industries.
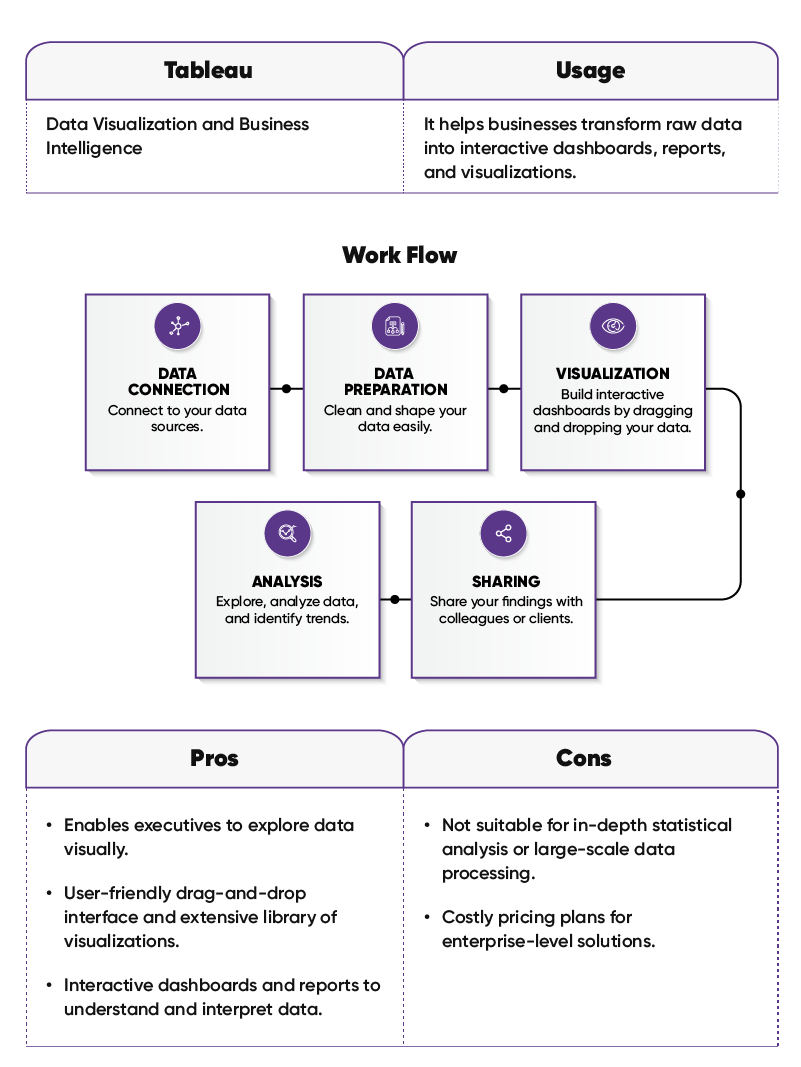
Tableau
Tableau is an empowering data analytics and visualization tool that transforms raw data into compelling visual narratives. Its intuitive interface allows for seamless exploration and interpretation of complex datasets, making it a favourite among analysts. With interactive dashboards and robust features, Tableau simplifies the journey from data to meaningful insights.
Related: How to Leverage Data for A Better Customer Experience
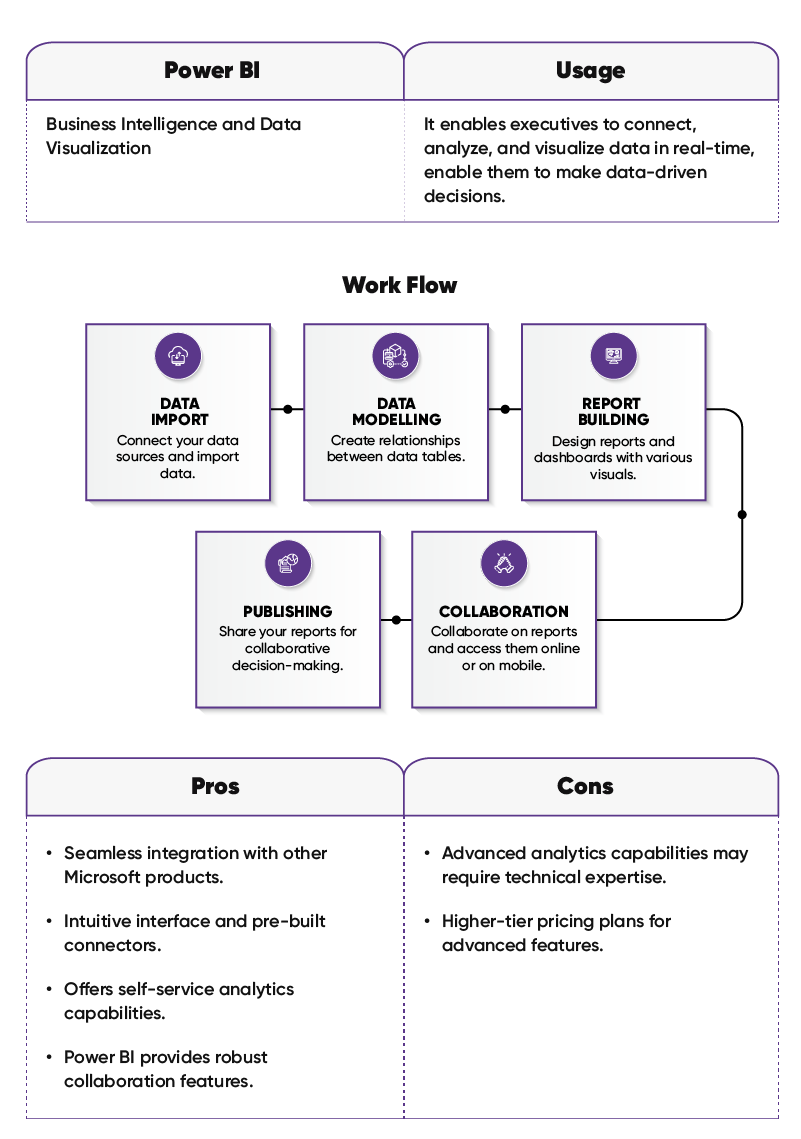
Power BI
Power BI, a leading data analytics and visualization tool, transforms raw data into compelling insights. Microsoft's user-friendly platform enables seamless exploration through interactive reports and dashboards. With robust connectivity and data transformation capabilities, Power BI empowers users to make informed decisions, driving business intelligence and analytics efficiency.
IBM Watson
IBM Watson is a cutting-edge data analytics and visualization tool leveraging advanced artificial intelligence. It excels in processing vast datasets, extracting valuable insights, and offering intuitive visualizations. Watson's cognitive capabilities enable businesses to make informed decisions, revolutionizing the data analytics landscape with its sophisticated and adaptive approach.
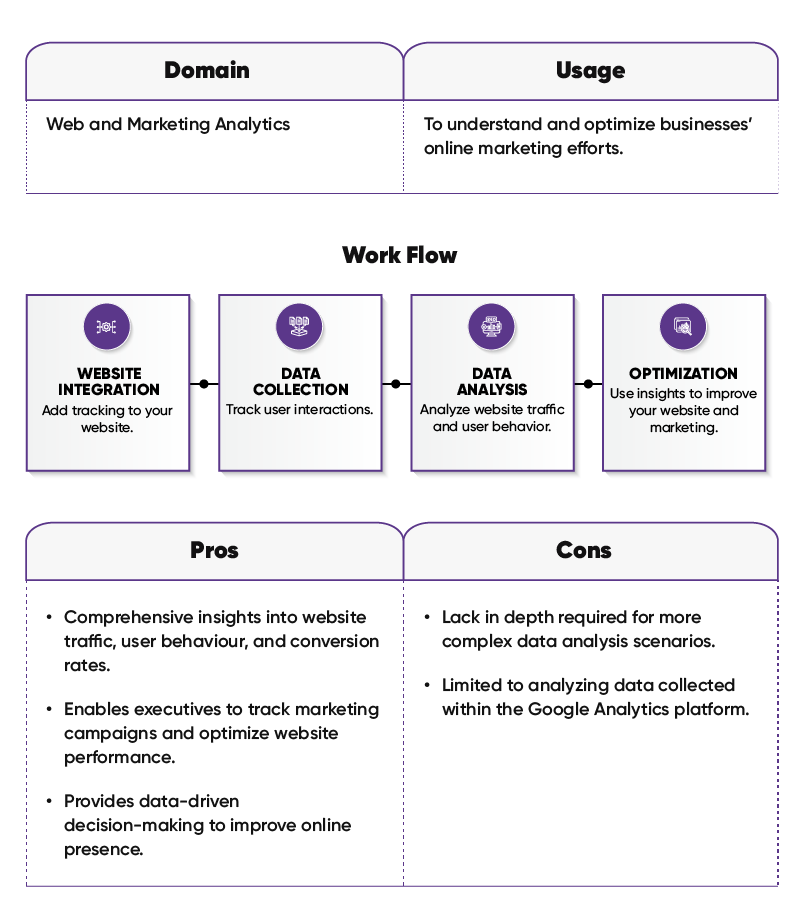
Google Analytics
Google Analytics is a premier data analytics and visualization tool, empowering businesses to understand online user behaviour. It tracks website traffic, user interactions, and provides insightful reports. With a user-friendly interface and customizable dashboards, it enables data-driven decision-making, optimizing digital strategies for enhanced online performance.
Must Read: Migrate to GA4 for Enhanced Insights
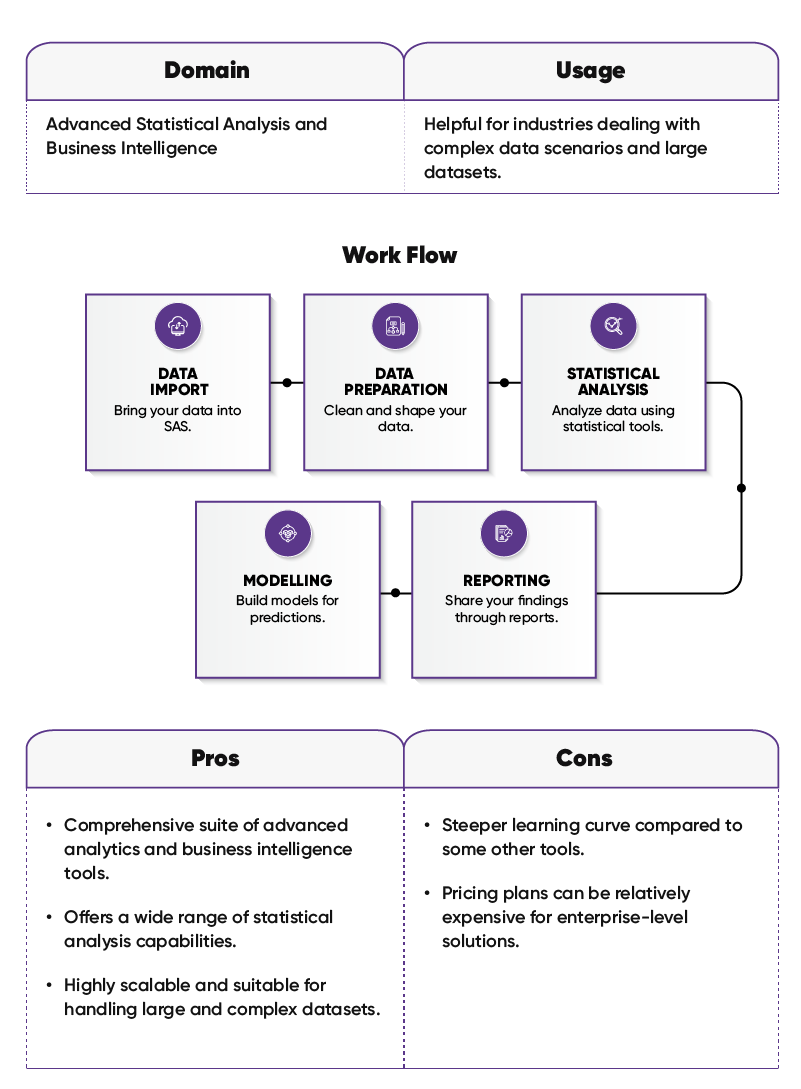
SAS
SAS (Statistical Analysis Software) is a leading data analytics and visualization tool, renowned for its powerful statistical analysis and business intelligence capabilities. Offering a comprehensive suite of tools, SAS enables users to derive meaningful insights, make informed decisions, and create compelling visualizations, contributing significantly to data-driven strategies in diverse industries.
Related: 5 Best Data Visualization Tools with Zero Coding Requirements
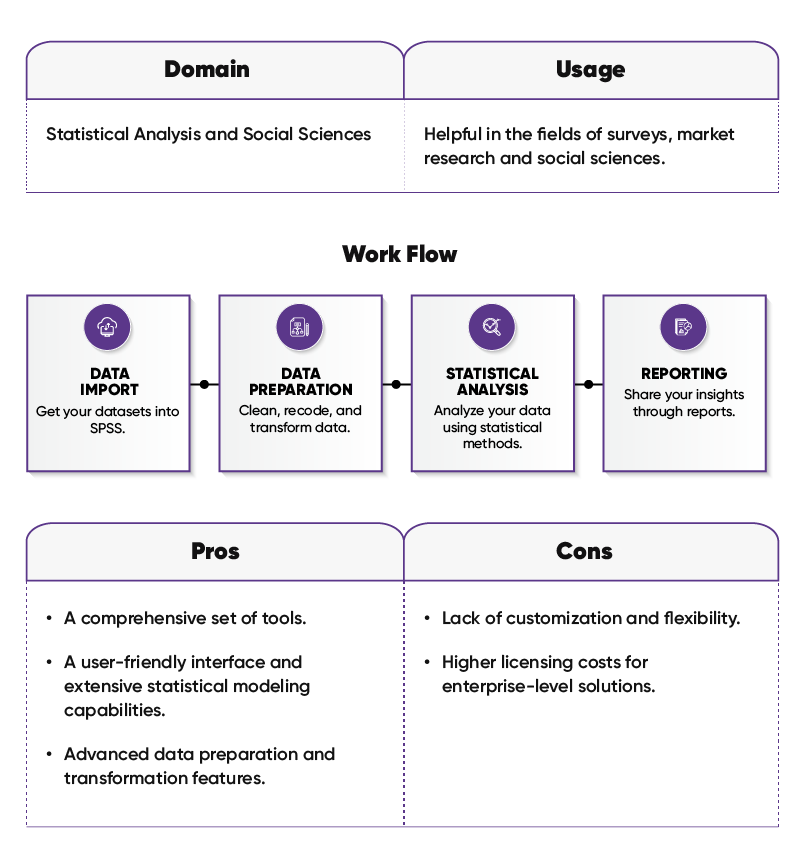
SPSS
SPSS (Statistical Package for the Social Sciences) is a prominent data analytics and visualization tool widely used for statistical analysis and research. With its user-friendly interface, SPSS facilitates data exploration, pattern identification, and robust visualization. It is favored in academia and industry, empowering users to extract valuable insights and drive evidence-based decision-making.
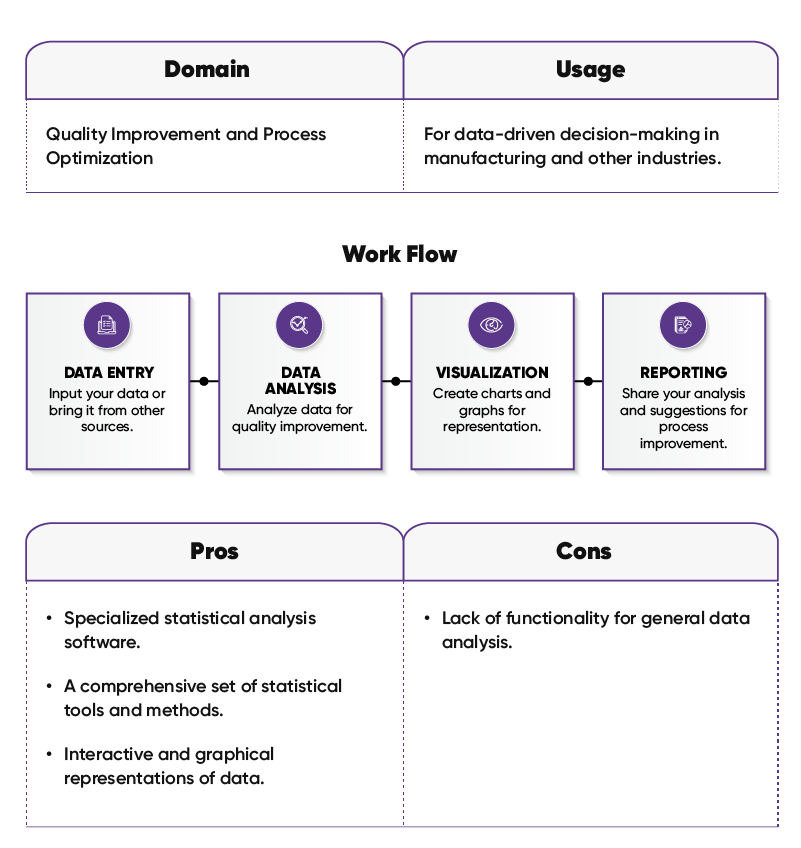
Minitab
Minitab stands out as a comprehensive data analytics and visualization tool specializing in statistical analysis and quality improvement. Widely utilized in industries like manufacturing and healthcare, Minitab offers a user-friendly platform for data exploration, hypothesis testing, and insightful visualization, supporting organizations in making data-driven decisions and optimizing processes.
The Bottomline
Selecting the right analytical tool is crucial for executives across industries to unlock the full potential of their data. Organizations must consider their specific requirements, data complexity, and skill sets to choose the analytical tool that best aligns with the business goals to empower the executives to make data-driven decisions.
If you seek expert advice on choosing the best data interpretation tool based on your unique business use case, you can talk to Icreon’s data analytics consultants.